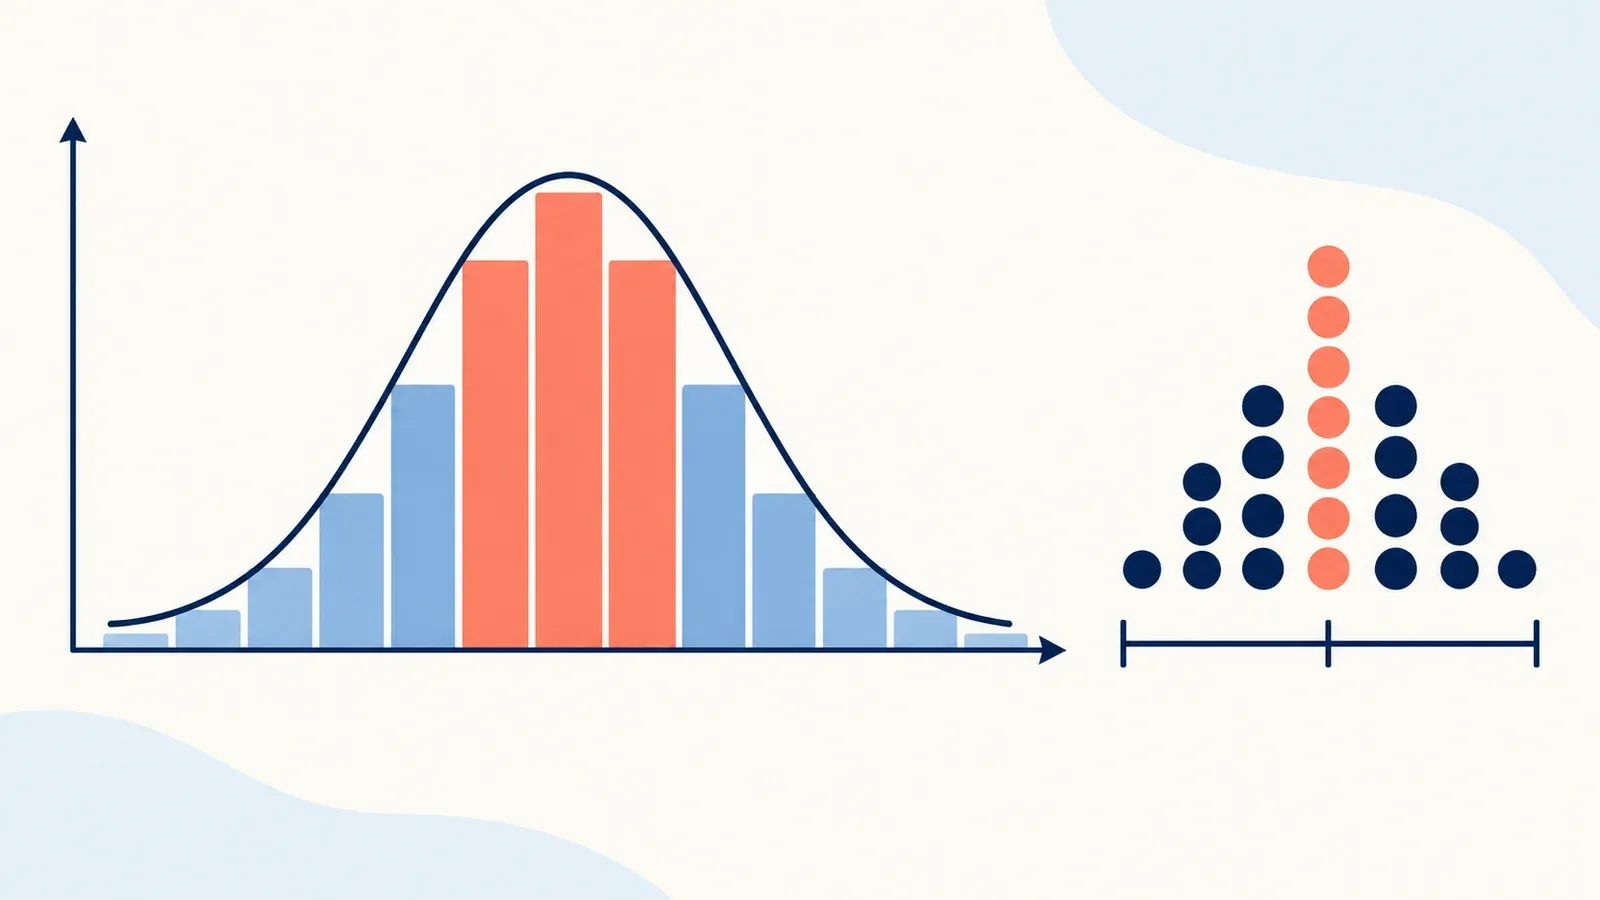
The statistics and distribution explorer takes a small set of numbers. It gives you the summary measures and a dot plot with a box plot. It also tests what an unusual value does to the mean and the median.
It also asks you questions about the shape of the data, because the numbers alone do not answer them.
How do you use it?
- Type your numbers in Data values, separated by commas, spaces or semicolons. Words such as NA or a question mark are treated as missing.
- Add a unit if you like, for example cm or RM. It is shown beside the results.
- Press Summarise. Press Reset to return to the sample.
- To test the effect of an outlier, change one value to something very large and press Summarise again.
How do you read the result?
The table gives the number of values, mean, median, mode, range, quartiles, interquartile range (IQR) and both standard deviations. The sorted data is listed so you can check the order.
The dot plot sits above a box plot that marks the minimum, Q1, median, Q3 and maximum. Quartiles are found as the median of each half of the sorted data, and the middle value is left out of both halves when the count is odd. A different calculator may use another method, so check what your course expects.
The outlier check uses the 1.5 × IQR fences. When a value lies outside the fences, the impact section removes it and compares the measures with and without it.
Example walk-through
The sample is 1, 2, 2, 3, 12.
- Mean: (1 + 2 + 2 + 3 + 12) ÷ 5 = 20 ÷ 5 = 4.
- Median: the middle of the ordered list is 2.
- Mode: 2, because it appears twice.
- Range: 12 − 1 = 11. Q1 = 1.5, Q3 = 7.5, so IQR = 6.
- Standard deviation: about 4.05 as a population and 4.53 as a sample.
Only one value out of five is above the median by much, yet it moves the mean to twice the median. The fences are −7.5 and 16.5, so the 1.5 × IQR rule does not call 12 an outlier. The tool reports that no value lies outside the fences and shows no removal comparison.
You can still check the effect of 12 by hand. Remove it yourself and work out 1, 2, 2, 3: mean 2, median 2. In this manual check the mean moved by 2 and the median did not move, because a value can matter without crossing a fence.
What are the assumptions and limits?
- The data stays in your browser. Nothing is uploaded, so do not paste real student records.
- Correlation is not automatically causation. The tool prompts you to think about this and does not test it.
- Quartile methods differ between textbooks and calculators.
- The tool describes the numbers you enter. It cannot tell you whether they were collected fairly.
Which lessons explain the ideas behind it?
- Choose an average for a stated question explains when mean, median or mode answers the question.
- Calculate a weighted mean covers groups of unequal size.
- Interpret grouped data without claiming exact raw values applies to tables rather than raw lists.
- Compare spread and centre together puts IQR and standard deviation to work.
- Identify an unsupported conclusion from a sample connects to the correlation and sampling prompts.
- Distinguish an average from a distribution shows the same idea in Geography.
The wider topic is statistics and distributions, and the mixed practice set tests it. Geography students can start at the Geography learning guide.
If choosing the right average or spread measure is the hard part, a teacher in online one-to-one Mathematics tuition can go through your own data questions. Other tools are in the learning tools directory.